
| 일 | 월 | 화 | 수 | 목 | 금 | 토 |
|---|---|---|---|---|---|---|
| 1 | 2 | 3 | 4 | 5 | ||
| 6 | 7 | 8 | 9 | 10 | 11 | 12 |
| 13 | 14 | 15 | 16 | 17 | 18 | 19 |
| 20 | 21 | 22 | 23 | 24 | 25 | 26 |
| 27 | 28 | 29 | 30 |
- iloc
- ADP
- 데이터분석전문가
- 데이터분석
- pandas
- 파이썬
- datascience
- 빅데이터분석기사
- dataframe
- Lambda
- 언더샘플링
- 텍스트분석
- LDA
- DBSCAN
- 빅데이터
- 독립표본
- 데이터불균형
- ADsP
- 주성분분석
- 군집화
- opencv
- 데이터분석준전문가
- 워드클라우드
- numpy
- 대응표본
- 크롤링
- t-test
- Python
- 오버샘플링
- PCA
Data Science LAB
[python] GMM(Gaussian Mixture Model) 본문
GMM
GMM 군집화는 군집화를 적용하고자 하는 데이터가 여러 개의 가우시안 분포를 가진 데이터 집합들이 섞여서 생성된 것이라는 가정하에 군집화를 수행하는 방식이다. 가우시안 분포는 정규 분포(Normal distribution)라고도 하며, 좌우 대칭형의 종 형태이다. GMM은 데이터를 여러개의 정규 분포가 섞인 것으로 간주하여 섞인 데이터 분포에서 개별 유형의 정규 분포를 추출한다.

전체 데이터 셋은 서로 다른 정규 분포 형태를 가진 여러 가지 확률 분포 곡선으로 구성될 수 있으며, 이렇게 서로 다른 정규 분포에 기반하여 군집화를 수행하는 것이 GMM 군집화 방식이다.
GMM을 이용한 iris 데이터셋 군집화
from sklearn.datasets import load_iris
from sklearn.cluster import KMeans

import matplotlib.pyplot as plt
import numpy as np
import pandas as pd
%matplotlib inline

iris = load_iris()
feature_names = ['sepal_length','sepal_width','petal_length','petal_width']

iris_df = pd.DataFrame(data = iris.data,columns=feature_names)
iris_df['target'] = iris.target
iris_df.head()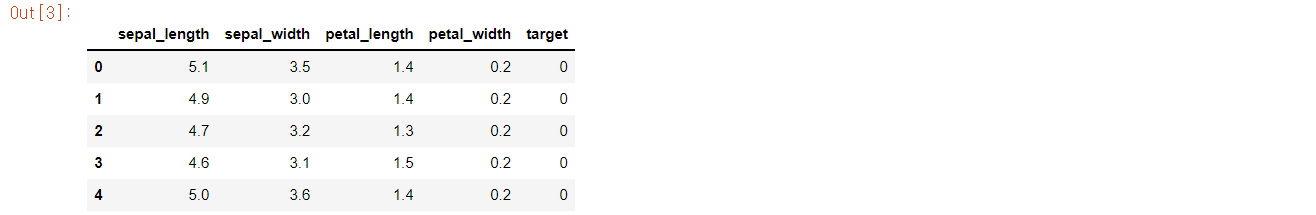
from sklearn.mixture import GaussianMixture

gmm = GaussianMixture(n_components=3, random_state = 0).fit(iris.data)
gmm_cluster_labels = gmm.predict(iris.data)

#군집화 결과를 iris_df에 저장
iris_df['gmm_cluster'] = gmm_cluster_labels
iris_df['target'] = iris.target

#target값에 따라 gmm_cluster가 어떻게 매핑됐는지 확인
gmm_result = iris_df.groupby('target')['gmm_cluster'].value_counts()
print(gmm_result)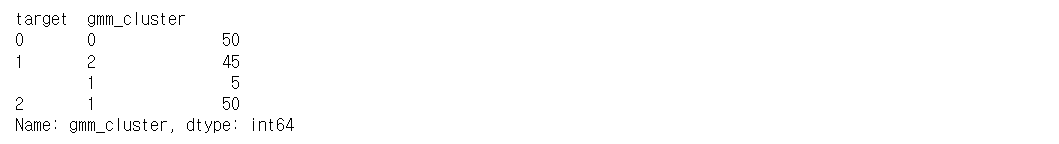
GMM에서 가장 중요한 파라미터는 n_components이다. gausian mixture 모델ㄹ의 총 개수이며, KMeans 군집 개수와 같이 중요한 역할을 한다. n_components를 3으로 설정하여 GaussianMixture로 군집화를 수행하였다.
Target 0 은 군집 0으로, Target 2는 군집 1로 잘 매핑 되었지만, target 1의 데이터 중 5개가 군집 2로 잘못 매핑되었다.
iris 데이터 KMeans 적용(n_clusters=3)
kmeans = KMeans(n_clusters = 3, init='k-means++',max_iter=300,random_state=0).fit(iris.data)
kmeans_cluster_labels = kmeans.predict(iris.data)
iris_df['kmeans_cluster'] = kmeans_cluster_labels
iris_result = iris_df.groupby(['target'])['kmeans_cluster'].value_counts()
print(iris_result)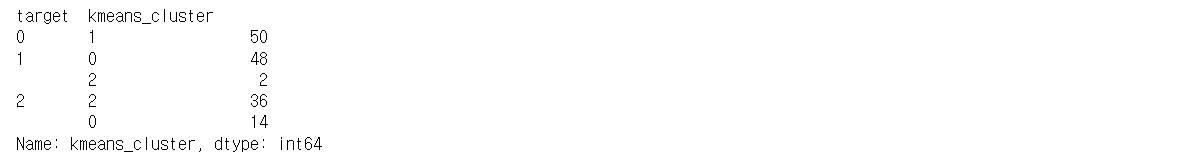
GMM보다 KMeans의 오차가 더 크다는 것을 확인할 수 있었다.
KMeans VS GMM
KMeans는 개별 군집의 중심에서 원형의 범위로 데이터를 군집화하기에 유리
GMM는 타원형의 데이터셋에 유리
def visualize_cluster_plot(clusterobj, dataframe, label_name, iscenter=True):
    if iscenter :
        centers = clusterobj.cluster_centers_

    unique_labels = np.unique(dataframe[label_name].values)
    markers=['o', 's', '^', 'x', '*']
    isNoise=False

    for label in unique_labels:
        label_cluster = dataframe[dataframe[label_name]==label]
        if label == -1:
            cluster_legend = 'Noise'
            isNoise=True
        else :
            cluster_legend = 'Cluster '+str(label)

        plt.scatter(x=label_cluster['ftr1'], y=label_cluster['ftr2'], s=70,\
                    edgecolor='k', marker=markers[label], label=cluster_legend)

        if iscenter:
            center_x_y = centers[label]
            plt.scatter(x=center_x_y[0], y=center_x_y[1], s=250, color='white',
                        alpha=0.9, edgecolor='k', marker=markers[label])
            plt.scatter(x=center_x_y[0], y=center_x_y[1], s=70, color='k',\
                        edgecolor='k', marker='$%d$' % label)
    if isNoise:
        legend_loc='upper center'
    else: legend_loc='upper right'

    plt.legend(loc=legend_loc)
    plt.show()
클러스터 결과를 담은 DataFrame과 사이킷런의 Cluster 객체등을 인자로 받아 클러스터링 결과를 시각화하는 함수 생성
타원형의 데이터셋 생성
from sklearn.datasets import make_blobs

X,y = make_blobs(n_samples=300,n_features=2,centers=3,cluster_std = 0.5,random_state=0)

#길게 늘어난 타원형의 데이터셋을 생성하기 위해 변환
transformation = [[0.60834549,-0.63667349],[-0.40887718,0.85253229]]
X_aniso = np.dot(X,transformation)

#feature데이터 셋과 make_blob의 결과값을 데이터프레임으로 저장
clusterDF = pd.DataFrame(data=X_aniso,columns=['ftr1','ftr2'])
clusterDF['target'] = y

#생성된 데이터셋을 target별로 다른 마커로 표시해 시각화
visualize_cluster_plot(None,clusterDF,'target',iscenter=False)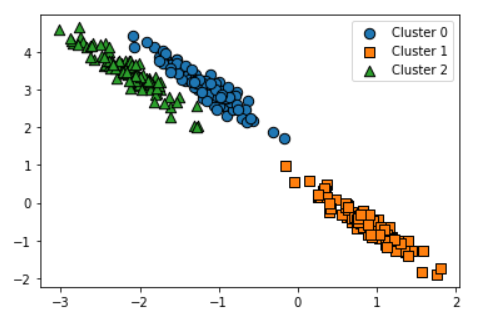
KMeans 적용
kmeans = KMeans(3,random_state=0)
kmeans_label = kmeans.fit_predict(X_aniso)
clusterDF['kmeans_label'] = kmeans_label

visualize_cluster_plot(kmeans,clusterDF,'kmeans_label',iscenter=True)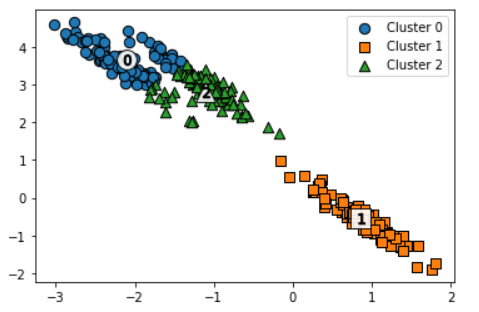
군집 0과 2가 잘 분류되지 않았다.
GMM 적용
#3개의 n_components기반 GMM을 X_aniso 데이터셋에 적용
gmm = GaussianMixture(n_components=3,random_state=0)
gmm_label = gmm.fit(X_aniso).predict(X_aniso)
clusterDF['gmm_label'] = gmm_label

#GaussianMixture는 cluster_centers속성이 없어 iscluster를 False로 설정
visualize_cluster_plot(gmm,clusterDF,'gmm_label',iscenter=False)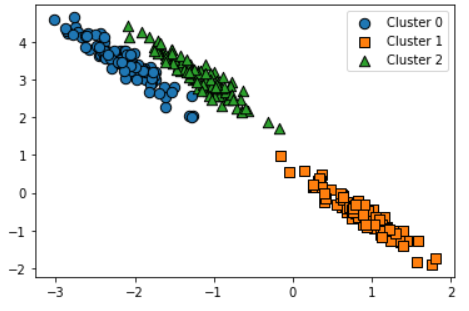
군집이 잘 분류되었다.
KMeans와 GMM비교
print("----- KMeans Clustering -----")
print(clusterDF.groupby('target')['kmeans_label'].value_counts())
print('\n------ Gaussian Mixture Clustering -----')
print(clusterDF.groupby('target')['gmm_label'].value_counts())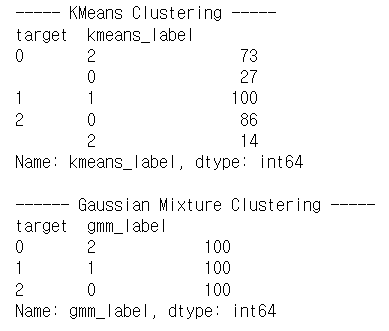
GMM은 KMeans보다 유연하게 다양한 데이터셋에 잘 적용되지만 군집화를 위한 수행시간이 오래걸린다.
'🛠 Machine Learning > Clustering' 카테고리의 다른 글
| [Python] DBSCAN (0) | 2022.03.04 |
|---|---|
| [Python] 평균 이동 (0) | 2022.03.02 |
| [Python] 군집 평가(실루엣 계수) (0) | 2022.03.01 |
| [Python] KMeans Clustering(K-평균 군집화) (0) | 2022.02.28 |


