
| 일 | 월 | 화 | 수 | 목 | 금 | 토 |
|---|---|---|---|---|---|---|
| 1 | 2 | 3 | ||||
| 4 | 5 | 6 | 7 | 8 | 9 | 10 |
| 11 | 12 | 13 | 14 | 15 | 16 | 17 |
| 18 | 19 | 20 | 21 | 22 | 23 | 24 |
| 25 | 26 | 27 | 28 | 29 | 30 | 31 |
- 주성분분석
- 오버샘플링
- 대응표본
- 빅데이터분석기사
- opencv
- DBSCAN
- numpy
- pandas
- 데이터불균형
- 독립표본
- Lambda
- datascience
- dataframe
- 언더샘플링
- 데이터분석준전문가
- 파이썬
- t-test
- 데이터분석
- 빅데이터
- 데이터분석전문가
- ADsP
- 크롤링
- ADP
- PCA
- 워드클라우드
- 군집화
- LDA
- Python
- 텍스트분석
- iloc
Data Science LAB
[Python] 군집 평가(실루엣 계수) 본문
Clustering Evaluation
iris 데이터셋에는 결과값에 품종을 의미하는 타깃 레이블이 있어 군집화가 얼마나 잘 이루어져 있는 지 판단할 수 있었다. 하지만 대부분의 군집화 데이터셋에는 타깃 레이블이 존재하지 않기 때문에, 데이터 내에 숨어 있는 별도의 그룹을 찾아 의미를 부여하고나, 동일한 분류 값에 속하더라도 그 안에서 더 세분화된 군집화를 추구하거나, 서로 다른 분류값의 데이터도 더 넓은 군집화 레벨화 등의 영역을 가지고 있다. 비지도학습의 특성 상 정확하게 성능을 평가하기는 어렵지만, 군집화의 성능을 평가하는 대표적인 방법으로 실루엣 분석을 사용한다.
Silhouette analysis
실루엣 분석이란 각 군집 간의 거리가 얼마나 효육적으로 분리되어 있는 지를 나타낸다. 효율적으로 분리되어 있는 것은 다른 군집과는 거리가 멀고, 동일 군집 내에서는 서로 가깝게 잘 뭉쳐 있다는 것을 의미한다.
실루엣 분석은 실루엣 계수(silhouette coefficient)를 기반으로 한다. 실루엣 계수는 개별 데이터가 같은 군집 내의 데이터와는 얼마나 가깝게 군집화 되어 있고, 다른 군집의 데이터와는 얼마나 멀리 분리 되어 있는 지를 나타내는 지표이다.

a(i) : 해당 데이터 포인트와 같은 군집 내에 있는 다른 데이터 포인트와의 거리를 평균한 값
b(i) : 해당 데이터 포인트가 속하지 않은 군집 중 가장 가까운 군집과의 평균 거리
두 군집간의 거리가 얼마나 떨어져 있는 가의 값은 b(i)-a(i) 이며, 이 값을 정규화 하기 위해 MAX(a(i),b(i))값으로 나눈다.
따라서 i번째 데이터 포인트의 실루엣 계수값 s(i)는 위와 같이 정의한다.
실루엣 계수는 -1~1사이의 값을 가지며, 1에 가까울 수록 근처의 군집과 더 멀리 떨어져 있는 것을 의미,
0에 가까울수록 근처의 군집과 가까워진다는 것을 의미한다.
-값은 아예 다른 군집에 데이터 포인트가 할당됐음을 의미한다.
좋은 군집화 조건
- 전체 실루엣 계수의 평균값, 즉 사이킷런의 silhouette_score()값이 0~1사이이며, 1에 가까울 수록 좋다.
- 전체 실루엣 계수의 평균값과 개별 군집의 평균값의 편차가 크지 않아야 한다. 즉, 개별 군집의 실루엣 계수 평균값이 전체 실루엣 계수의 평균값에서 크게 벗어나지 않아야 한다.
iris 데이터 셋을 이용한 군집 평가
sklearn.metircs 모듈의 silhouette_samples()와 silhouette_score()이용
from sklearn.preprocessing import scale
from sklearn.datasets import load_iris
from sklearn.cluster import KMeans
from sklearn.metrics import silhouette_samples, silhouette_score
import matplotlib.pyplot as plt
import numpy as np
import pandas as pd
%matplotlib inline

iris = load_iris()
feature_names = ['sepal_length','sepal_width','petal_length','petal_width']
irisdf = pd.DataFrame(data = iris.data,columns = feature_names)
kmeans = KMeans(n_clusters=3,init='k-means++',max_iter=300,random_state=0).fit(irisdf)
irisdf['cluster'] = kmeans.labels_

#iris의 모든 개별 데이터에 실루엣 계수 값을 구함
score_samples = silhouette_samples(iris.data,irisdf['cluster'])
print('실루엣 return 값의 shape : ',score_samples.shape)

#irisdf에 실루엣 계수 칼럼 추가
irisdf['silhouette'] = score_samples

#모든 데이터의 평균 실루엣 계수 값
average_score = silhouette_score(iris.data,irisdf['cluster'])
print('붓꽃 데이터 셋 Silhoutte Anaylsis Score : {:.3f}'.format(average_score))
irisdf.head()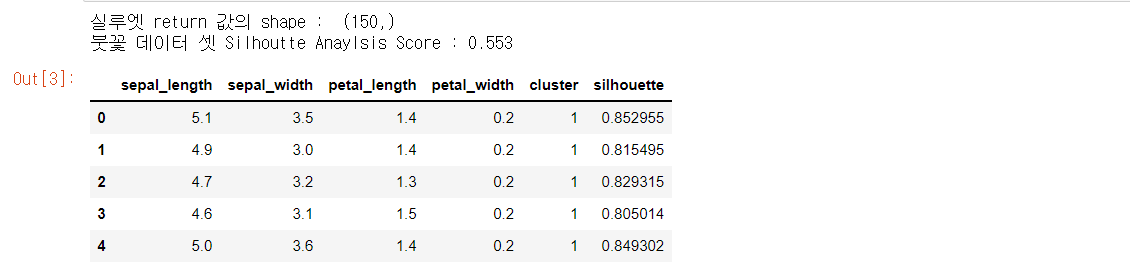
평균 실루엣 계수 값은 0.553이지만, 1번 군집의 실루엣 계수 값은 0.8이상으로 높게 나타난다.
irisdf.groupby('cluster')['silhouette'].mean()
군집 컬럼별로 group by 하여 실루엣 계수의 평균값을 출력해 보니 1번 군집은 0.79이지만 0번 군집과 2번 군집은 0.4로 상대적으로 평균값이 1번에 비하여 낮은 것을 확인할 수 있었다.
군집별 평균 실루엣 계수와 시각화를 통한 군집 개수 최적화 방법
전체 데이터의 평균 실루엣 계수 값이 높다고 해서 반드시 최적 군집 개수로 군집화가 잘 됐다고 볼 수는 없다.
개별 군집별로 적당히 분리된 거리를 유지하면서 군집 내의 데이터가 서로 뭉쳐 있는 경우에 KMeans의 적절한 군집 개수가 설정되었다고 판단할 수 있다.
실루엣 계수 시각화 함수
def visualize_silhouette(cluster_lists, X_features):

    from sklearn.datasets import make_blobs
    from sklearn.cluster import KMeans
    from sklearn.metrics import silhouette_samples, silhouette_score

    import matplotlib.pyplot as plt
    import matplotlib.cm as cm
    import math

    # 입력값으로 클러스터링 갯수들을 리스트로 받아서, 각 갯수별로 클러스터링을 적용하고 실루엣 개수를 구함
    n_cols = len(cluster_lists)

    # plt.subplots()으로 리스트에 기재된 클러스터링 수만큼의 sub figures를 가지는 axs 생성
    fig, axs = plt.subplots(figsize=(4*n_cols, 4), nrows=1, ncols=n_cols)

    # 리스트에 기재된 클러스터링 갯수들을 차례로 iteration 수행하면서 실루엣 개수 시각화
    for ind, n_cluster in enumerate(cluster_lists):

        # KMeans 클러스터링 수행하고, 실루엣 스코어와 개별 데이터의 실루엣 값 계산.
        clusterer = KMeans(n_clusters = n_cluster, max_iter=500, random_state=0)
        cluster_labels = clusterer.fit_predict(X_features)

        sil_avg = silhouette_score(X_features, cluster_labels)
        sil_values = silhouette_samples(X_features, cluster_labels)

        y_lower = 10
        axs[ind].set_title('Number of Cluster : '+ str(n_cluster)+'\n' \
                          'Silhouette Score :' + str(round(sil_avg,3)) )
        axs[ind].set_xlabel("The silhouette coefficient values")
        axs[ind].set_ylabel("Cluster label")
        axs[ind].set_xlim([-0.1, 1])
        axs[ind].set_ylim([0, len(X_features) + (n_cluster + 1) * 10])
        axs[ind].set_yticks([])  # Clear the yaxis labels / ticks
        axs[ind].set_xticks([0, 0.2, 0.4, 0.6, 0.8, 1])

        # 클러스터링 갯수별로 fill_betweenx( )형태의 막대 그래프 표현.
        for i in range(n_cluster):
            ith_cluster_sil_values = sil_values[cluster_labels==i]
            ith_cluster_sil_values.sort()

            size_cluster_i = ith_cluster_sil_values.shape[0]
            y_upper = y_lower + size_cluster_i

            color = cm.nipy_spectral(float(i) / n_cluster)
            axs[ind].fill_betweenx(np.arange(y_lower, y_upper), 0, ith_cluster_sil_values, \
                                facecolor=color, edgecolor=color, alpha=0.7)
            axs[ind].text(-0.05, y_lower + 0.5 * size_cluster_i, str(i))
            y_lower = y_upper + 10

        axs[ind].axvline(x=sil_avg, color="red", linestyle="--")
# make_blobs 을 통해 clustering 을 위한 4개의 클러스터 중심의 500개 2차원 데이터 셋 생성
from sklearn.datasets import make_blobs
X, y = make_blobs(n_samples=500, n_features=2, centers=4, cluster_std=1, \
center_box=(-10.0, 10.0), shuffle=True, random_state=1)
# cluster 개수를 2개, 3개, 4개, 5개 일때의 클러스터별 실루엣 계수 평균값을 시각화
visualize_silhouette([ 2, 3, 4, 5], X)
군집이 각각 2,3,4,5개일 때의 실루엣 계수를 시각화 해본 결과 4개로 군집화하였을 때 가장 이상적이라고 할 수 있다.
1) 군집이 2개일 때
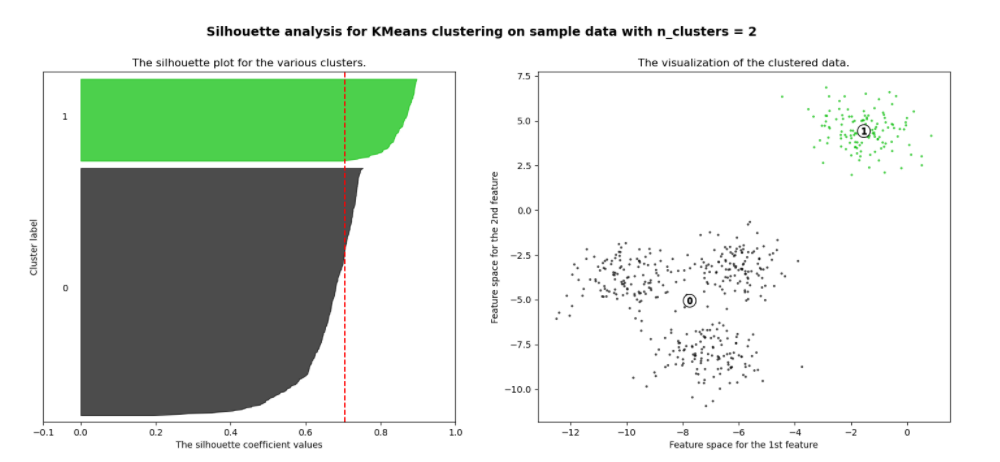
1번 군집은 0번 군집과 멀리 떨어져 있고, 내부 데이터끼리도 잘 뭉쳐 있지만, 0번 군집의 내부 데이터끼리는 많이 떨어져 있다.
2) 군집이 3개일 때
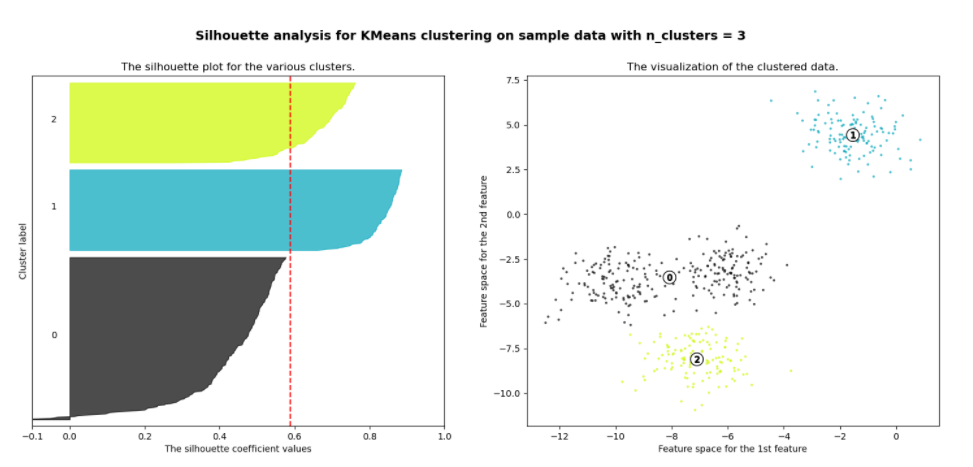
1번 군집과 2번 군집은 실루엣 계수가 평균값 이상이며 군집의 내부 데이터들이 잘 뭉쳐져 있지만,
0번 군집의 실루엣 계수는 평균 이하이며 멀리 퍼져 있다.
3) 군집이 4개일 때
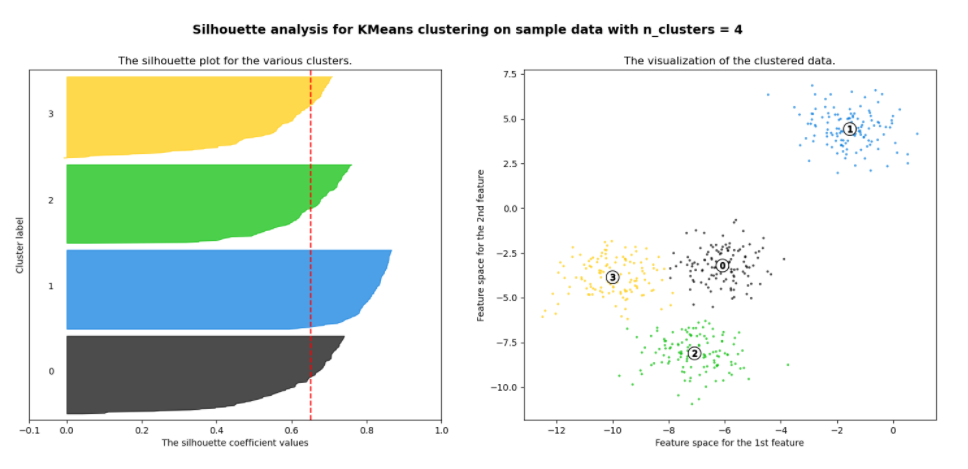
1번 군집의 모든 값은 평균 이상이며, 나머지 군집들의 데이터들도 평균 이상인 경우가 많아 가장 이상적인 군집화 개수로 판단할 수 있다.
iris 데이터의 군집화 결과 시각화
from sklearn.datasets import load_iris

iris=load_iris()
visualize_silhouette([ 2, 3, 4,5 ], iris.data)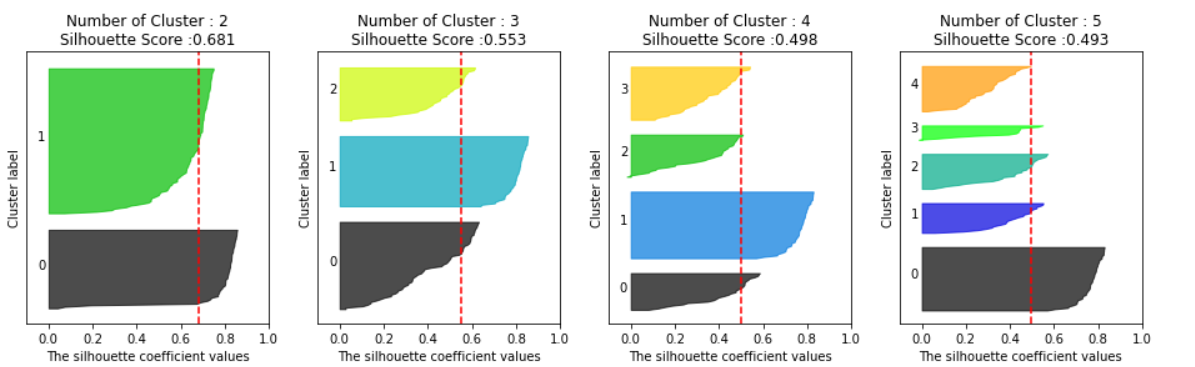
iris 데이터의 군집화 결과 2개의 군집으로 나누는 것이 가장 바람직해 보인다.
##참고
https://scikit-learn.org/stable/auto_examples/cluster/plot_kmeans_silhouette_analysis.html
Selecting the number of clusters with silhouette analysis on KMeans clustering
Silhouette analysis can be used to study the separation distance between the resulting clusters. The silhouette plot displays a measure of how close each point in one cluster is to points in the ne...
scikit-learn.org
'🛠 Machine Learning > Clustering' 카테고리의 다른 글
| [Python] DBSCAN (0) | 2022.03.04 |
|---|---|
| [python] GMM(Gaussian Mixture Model) (0) | 2022.03.03 |
| [Python] 평균 이동 (0) | 2022.03.02 |
| [Python] KMeans Clustering(K-평균 군집화) (0) | 2022.02.28 |


