
| 일 | 월 | 화 | 수 | 목 | 금 | 토 |
|---|---|---|---|---|---|---|
| 1 | 2 | 3 | 4 | 5 | 6 | |
| 7 | 8 | 9 | 10 | 11 | 12 | 13 |
| 14 | 15 | 16 | 17 | 18 | 19 | 20 |
| 21 | 22 | 23 | 24 | 25 | 26 | 27 |
| 28 | 29 | 30 | 31 |
- 데이터분석전문가
- 데이터분석
- 빅데이터분석기사
- numpy
- 주성분분석
- 데이터불균형
- 빅데이터
- 군집화
- DBSCAN
- pandas
- 언더샘플링
- 독립표본
- LDA
- 대응표본
- 데이터분석준전문가
- t-test
- PCA
- 오버샘플링
- dataframe
- datascience
- iloc
- Python
- opencv
- 워드클라우드
- 파이썬
- ADP
- 텍스트분석
- 크롤링
- ADsP
- Lambda
Data Science LAB
[Python] DBSCAN 본문
DBSCAN
DBSCAN은 밀도 기반의 군집화 대표 알고리즘이다. 간단하고 직관적인 알고리즘으로 데이터의 분포가 기하학적으로 복잡한 경우에도 효과적으로 군집화할 수 있다.

위의 그림과 같이 원형의 데이터 분포를 띄는 경우, KMeans 나 GMM은 군집화를 잘 수행하지 못한다.
- 입실론 주변 영역(epsilon) : 개별 데이터를 중심으로 입실론 반경을 가지는 원형의 영역
- 최소 데이터 개수(min points) : 개별 데이터의 주변 영역에 포함되는 타 데이터의 개수
입실론 주변 영역 내에 포함되는 최소 데이터 개수를 충족시키는가에 따라 데이터 포인트를 다음과 같이 정의한다.
- 핵심 포인트(Core Point) : 주변 영역 내에 최소 데이터 개수 이상의 타 데이터를 가지고 있을 경우, 해당 데이터를 의미
- 이웃 포인트(Neighbor Point) : 주변 영역 내에 위치한 타 데이터
- 경계 포인트(Border Point) : 주변 영역 내에 최소 데이터 개수 이상의 이웃 포인트를 가지고 있지 않지만, 핵심 포인트를 이웃 포인트로 가지고 있는 데이터
- 잡음 포인트(Noise Point) : 최소 데이터 개수 이상의 이웃 포인트를 가지고 있지 않으며, 핵심 포인트도 이웃 포인트로 가지고 있지 않은 데이터

1. epsilon과 min points 설정
2. 데이터로부터 Core Points의 조건을 만족하는 임의의 점 선택
3. 밀도 - 도달 가능한 점을 뽑아 Core Points와 Border Points 구분, 이에 속하지 않은 점들은 Noise Points로 구분
4. epsilon 반경 안의 Core Points 연결
5. 연결된 점들은 하나의 군집으로 형성
6. 모든 점들은 군집에 할당해야함(여러 군집에 걸쳐있으면, 먼저 할당된 군집으로 할당)
iris 데이터에 적용
데이터 및 라이브러리 로딩
from sklearn.datasets import load_iris
from sklearn.cluster import KMeans

import matplotlib.pyplot as plt
import numpy as np
import pandas as pd
%matplotlib inline

iris = load_iris()
feature_names = ['sepal_length','sepal_width','petal_length','petal_width']

iris_df = pd.DataFrame(data = iris.data,columns=feature_names)
iris_df['target'] = iris.target
iris_df.head()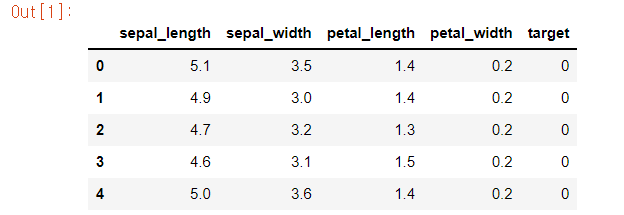
DBSCAN 적용
from sklearn.cluster import DBSCAN

dbscan = DBSCAN(eps=0.6,min_samples =8, metric='euclidean')
dbscan_labels = dbscan.fit_predict(iris.data)
iris_df['dbscan_cluster'] = dbscan_labels
iris_df['target'] = iris.target

iris_result = iris_df.groupby(['target'])['dbscan_cluster'].value_counts()
print(iris_result)
-1로 표현된 군집 레이블은 Noise Point를 의미한다. 3개의 타겟이지만, 실제 군집은 0,1 두가지로 이루어진 것을 확인할 수있다. (꼭 안좋은 것은 아님!)
PCA를 적용하여 2개의 피처로 압축
#군집 생성 및 시각화하는 함수 생성
def visualize_cluster_plot(clusterobj, dataframe, label_name, iscenter=True):
    if iscenter :
        centers = clusterobj.cluster_centers_

    unique_labels = np.unique(dataframe[label_name].values)
    markers=['o', 's', '^', 'x', '*']
    isNoise=False

    for label in unique_labels:
        label_cluster = dataframe[dataframe[label_name]==label]
        if label == -1:
            cluster_legend = 'Noise'
            isNoise=True
        else :
            cluster_legend = 'Cluster '+str(label)

        plt.scatter(x=label_cluster['ftr1'], y=label_cluster['ftr2'], s=70,\
                    edgecolor='k', marker=markers[label], label=cluster_legend)

        if iscenter:
            center_x_y = centers[label]
            plt.scatter(x=center_x_y[0], y=center_x_y[1], s=250, color='white',
                        alpha=0.9, edgecolor='k', marker=markers[label])
            plt.scatter(x=center_x_y[0], y=center_x_y[1], s=70, color='k',\
                        edgecolor='k', marker='$%d$' % label)
    if isNoise:
        legend_loc='upper center'
    else: legend_loc='upper right'

    plt.legend(loc=legend_loc)
    plt.show()
from sklearn.decomposition import PCA
pca = PCA(n_components=2,random_state = 0)
pca_transformed = pca.fit_transform(iris.data)
iris_df['ftr1'] = pca_transformed[:,0]
iris_df['ftr2'] = pca_transformed[:,1]
visualize_cluster_plot(dbscan,iris_df,'dbscan_cluster',iscenter = False)
⭐ 표시는 잡음(Noise)를 의미한다.
Noise 데이터가 많이 보이는 것을확인할 수 있다.
eps를 크게 하면 반경이 커져 포함하는 데이터가 많아져 노이즈 데이터가 감소한다.
min_samples를 크게 하면 주어진 반경 내에 더 많은 데이터를 포함시켜야 하므로 노이즈 개수가 커지게 된다.
eps 증가(0.6 => 0.8)
dbscan = DBSCAN(eps=0.8,min_samples = 8, metric='euclidean')
dbscan_labels = dbscan.fit_predict(iris.data)

iris_df['dbscan_cluster'] = dbscan_labels
iris_df['target'] = iris.target

iris_result = iris_df.groupby(['target'])['dbscan_cluster'].value_counts()
print(iris_result)

visualize_cluster_plot(dbscan,iris_df,'dbscan_cluster',iscenter=False)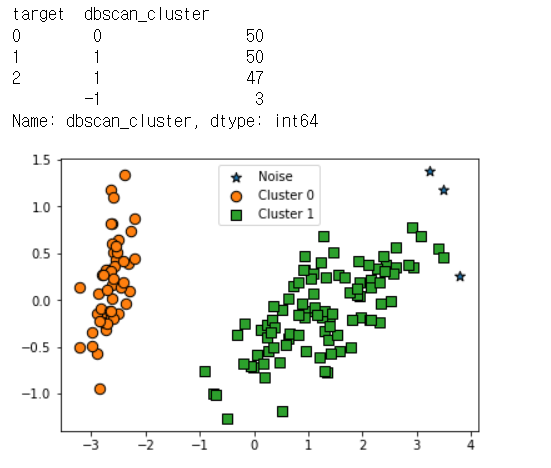
노이즈가 3개로 감소한 것을 볼 수 있다.
min_samples 증가(8 => 16)
dbscan = DBSCAN(eps=0.6,min_samples=16,metric='euclidean')
iris_result = iris_df.groupby(['target'])['dbscan_cluster'].value_counts()
print(iris_result)

visualize_cluster_plot(dbscan,iris_df,'dbscan_cluster',iscenter=False)
노이즈 개수는 똑같다.
make_circles를 이용해 데이터 셋 생성
KMeans VS GMM VS DBSCAN
from sklearn.datasets import make_circles
X,y = make_circles(n_samples=1000, shuffle=True, noise=0.05, random_state =0,factor=0.5)
clusterDF = pd.DataFrame(data=X,columns=['ftr1','ftr2'])
clusterDF['target'] = y

visualize_cluster_plot(None, clusterDF, 'target', iscenter=False)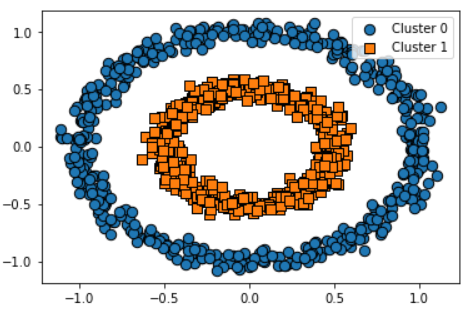
KMEANS
from sklearn.cluster import KMeans

kmeans = KMeans(n_clusters=2,max_iter=1000,random_state=0)
kmeans_labels = kmeans.fit_predict(X)
clusterDF['kmeans_cluster'] = kmeans_labels
visualize_cluster_plot(kmeans,clusterDF,'kmeans_cluster',iscenter=True)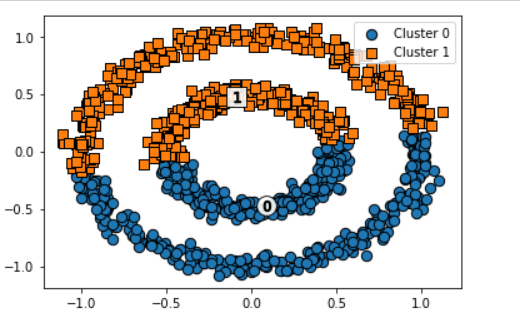
군집화가 잘 이루어지지 않았다.
GMM
from sklearn.mixture import GaussianMixture

gmm = GaussianMixture(n_components=2,random_state = 0)
gmm_label = gmm.fit_predict(X)
clusterDF['gmm_cluster'] = gmm_label
visualize_cluster_plot(gmm,clusterDF,'gmm_cluster',iscenter=False)
마찬가지로 군집화가 잘 이루어 지지 않았다.
DBSCAN
from sklearn.cluster import DBSCAN

dbscan = DBSCAN(eps=0.2,min_samples=10, metric='euclidean')
dbscan_labels = dbscan.fit_predict(X)
clusterDF['dbscan_cluster'] = dbscan_labels
visualize_cluster_plot(dbscan,clusterDF,'dbscan_cluster',iscenter=False)
정확하게 군집화가 되었다.
DBSCAN은 원형의 데이터셋에서 군집화가 잘 이루어지는 것을 확인
'🛠 Machine Learning > Clustering' 카테고리의 다른 글
| [python] GMM(Gaussian Mixture Model) (0) | 2022.03.03 |
|---|---|
| [Python] 평균 이동 (0) | 2022.03.02 |
| [Python] 군집 평가(실루엣 계수) (0) | 2022.03.01 |
| [Python] KMeans Clustering(K-평균 군집화) (0) | 2022.02.28 |


