
| 일 | 월 | 화 | 수 | 목 | 금 | 토 |
|---|---|---|---|---|---|---|
| 1 | ||||||
| 2 | 3 | 4 | 5 | 6 | 7 | 8 |
| 9 | 10 | 11 | 12 | 13 | 14 | 15 |
| 16 | 17 | 18 | 19 | 20 | 21 | 22 |
| 23 | 24 | 25 | 26 | 27 | 28 |
Tags
- 군집화
- Python
- 독립표본
- datascience
- ADsP
- dataframe
- 워드클라우드
- 데이터분석준전문가
- 빅데이터분석기사
- 데이터분석
- 데이터불균형
- t-test
- DBSCAN
- 대응표본
- 데이터분석전문가
- iloc
- 주성분분석
- 텍스트분석
- 크롤링
- 오버샘플링
- Lambda
- ADP
- LDA
- PCA
- numpy
- pandas
- opencv
- 파이썬
- 언더샘플링
- 빅데이터
Archives
Data Science LAB
[Python] 데이터 에듀 ADP 실기 모의고사 3회 2번 파이썬 ver. (정형데이터마이닝) 본문
728x90
사용 데이터 : BlackFriday.csv
| 변수 | 데이터 형태 | 설명 |
| User_ID | 문자형 | 구매자 ID |
| Product_ID | 범주형 | 제품 ID |
| Gender | 범주형 | 성별 |
| Age | 범주형 | 나이(구간화) |
| Occupation | 범주형 | 구매자 직업 |
| City_Category | 범주형 | 거주 지역 |
| Stay_In_Current_City_Years | 범주형 | 현재 도시에 체류하는 년수 |
| Marital_Status | 범주형 | 결혼 여부 |
| Product_Category_1 | 범주형 | 상품 구매 카테고리 |
| Product_Category_2 | 범주형 | 1번 제품 카테고리에 속하는 제품의 카테고리 |
| Product_Category_3 | 범주형 | 2번 제품 카테고리에 속하는 제품의 카테고리 |
| Purchase | 수치형 | 구매금액(달러) |
1. BlackFriday 데이터에서 Product_Category_2, Product_category_3의 NA값을 0으로 대체하고, Product_Category_1,2,3 변수의 값을 다 더한 Product_all 변수를 생성하여 추가하라. 그리고 User_ID를 charactor 변수로, Occupation, Marital_Status, Product_Category_1,2,3변수를 범주형 변수로 변환하시오. 마지막으로 범주형 변수인 Gender, Age, City_Category, Stay_In_Current_City_Years를 더미변수로 변환해서 BlackFriday 데이터에 추가하시오.
import pandas as pd

df = pd.read_csv('../data/BlackFriday.csv')
df.head()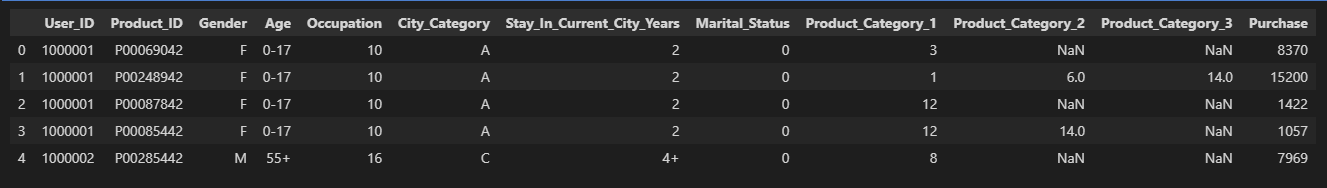
df.isna().sum()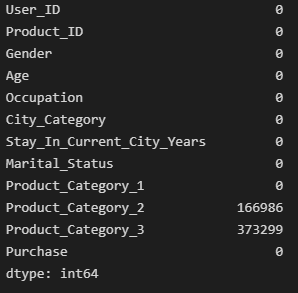
Product_Category_2,3 변수에만 결측치가 있는 것을 확인
# Product_Category 2, 3의 NA값 0으로 대체
df['Product_Category_2'].fillna(0,inplace=True)
df['Product_Category_3'].fillna(0, inplace=True)

df.isna().sum()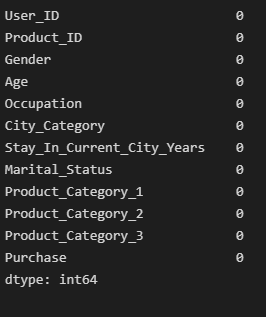
# product_All변수 생성
df['Product_All'] = df['Product_Category_1'] + df['Product_Category_2'] + df['Product_Category_3']
df.head()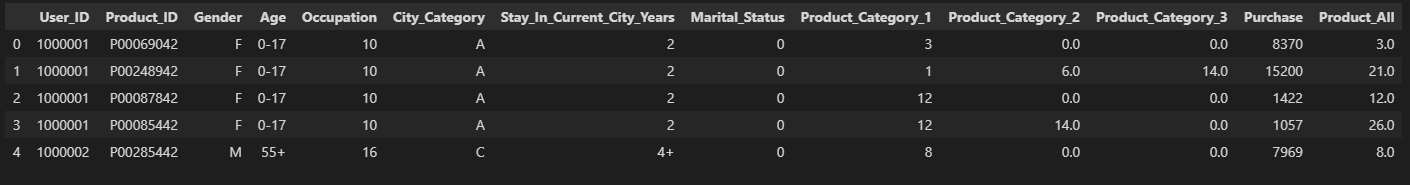
df.info()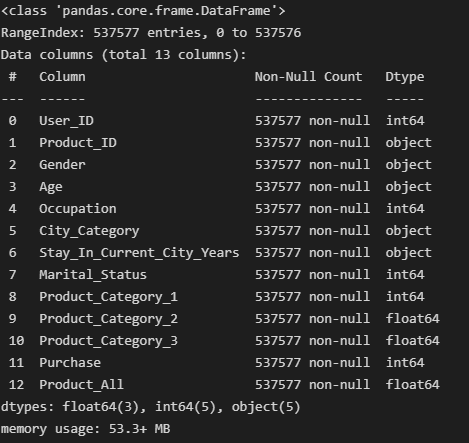
# 데이터 형변환
df['User_ID'] = df['User_ID'].astype('str')
df[['Occupation', 'Marital_Status', 'Product_Category_1', 'Product_Category_2', 'Product_Category_3']] = df[['Occupation', 'Marital_Status', 'Product_Category_1', 'Product_Category_2', 'Product_Category_3']].astype('category')
df.info()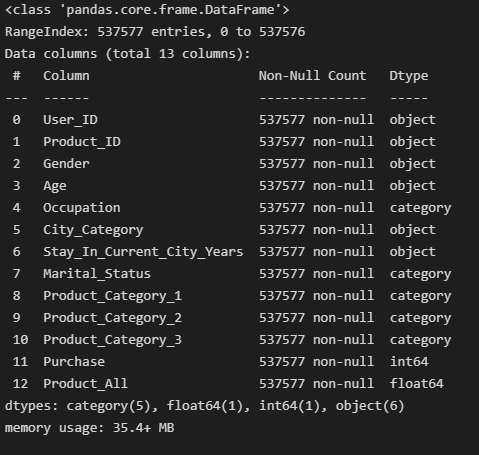
# 더미 변수 변환
df_dummy = pd.get_dummies(df, columns=['Gender', 'Age', 'City_Category', 'Stay_In_Current_City_Years'])
df_dummy.head()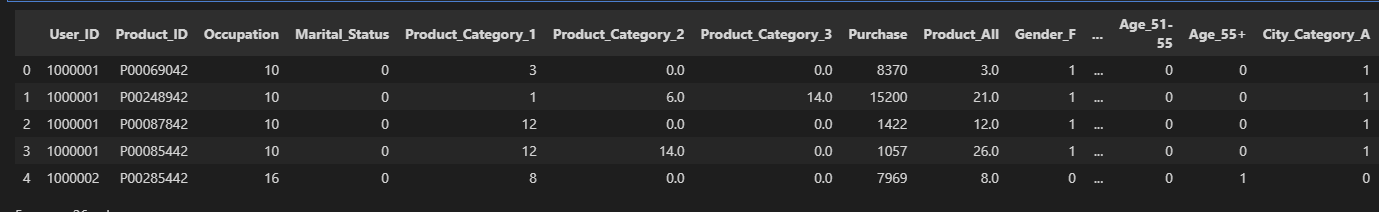
2. 1에서 전처리가 완료된 데이터에서 User_Id, Product_ID, Gender, Age, City_Category, Stay_In_Current_City_Years, Product_all 변수를 제외한 나머지 변수들을 활용하여 kmeans 군집 분석을 수행하고 해석하시오. (범주형 변수는 수치형 변수로 변환하여 분석에 활용하시오.) 그리고 최적의 군집 개수를 찾아서 만일 군집 개수가 이전 결과와 다르면 분석을 다시 수행하여 해석하시오.
import matplotlib.pyplot as plt
from sklearn.cluster import KMeans
from sklearn.preprocessing import LabelEncoder
from sklearn.metrics import calinski_harabasz_score

df_kmeans = df[['Occupation', 'Marital_Status', 'Product_Category_1', 'Product_Category_2', 'Product_Category_3', 'Purchase']]

for column in df_kmeans.columns.difference(['Purchase']):
    le = LabelEncoder()
    df_kmeans[column] = le.fit_transform(df_kmeans[column])

def elbow(X):
    sse = []

    for i in range(2,10):
        km = KMeans(n_clusters=i, random_state=1)
        km.fit(X)
        sse.append(km.inertia_)

    plt.plot(range(2,10), sse, marker='o')
    plt.xlabel('The Number of Clusters')
    plt.ylabel('SSE')
    plt.show()
    print(sse)

elbow(df_kmeans)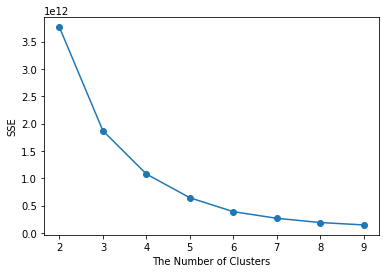
k = 4 또는 5일떄 곡선이 완만해 지는 것을 확인함 -> 5로 선택
3. 최적의 군집 개수를 찾아 재수행한 군집분석의 결과로 분류된 군집번호를 원본 데이터인 BlackFriday데이터의 각 행에 맞게 labeling 하여 clust라는 변수로 저장하고, cluster별 특성을 파악하여 설명하시오.
km = KMeans(n_clusters=5, random_state=1)
km.fit(df_kmeans)

new_labels = km.labels_
df['clust'] = new_labels
df.head()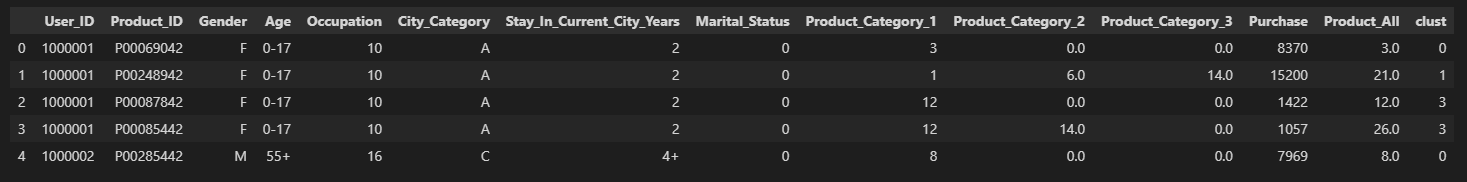
import seaborn as sns

sns.pairplot(df,diag_kind='kde', hue='clust',corner=True,palette='bright')
plt.show()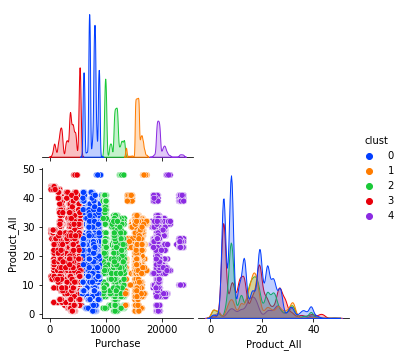
728x90
'adp 실기 > 기출문제' 카테고리의 다른 글
| [Python] 데이터 에듀 ADP 실기 모의고사 파이썬 ver. (정형 데이터마이닝) (0) | 2022.09.08 |
|---|---|
| [Python] 데이터 에듀 ADP 실기 모의고사 3회 3번 파이썬 ver. (비정형 데이터마이닝) (0) | 2022.09.07 |
| [Python] 데이터 에듀 ADP 실기 모의고사 3회 1번 파이썬 ver. (통계 분석) (0) | 2022.09.05 |
| [Python] 데이터 에듀 ADP 실기 모의고사 2회 3번 파이썬 ver. (비정형 데이터마이닝) (0) | 2022.09.04 |
| [Python] 데이터 에듀 ADP 실기 모의고사 2회 2번 파이썬 ver. (정형데이터마이닝) (0) | 2022.09.03 |
'adp 실기/기출문제' Related Articles
more


Comments